Quantifying Incarceration
The numbers on mass incarceration make one thing clear: it is a gigantic machine for entrenching inequality.
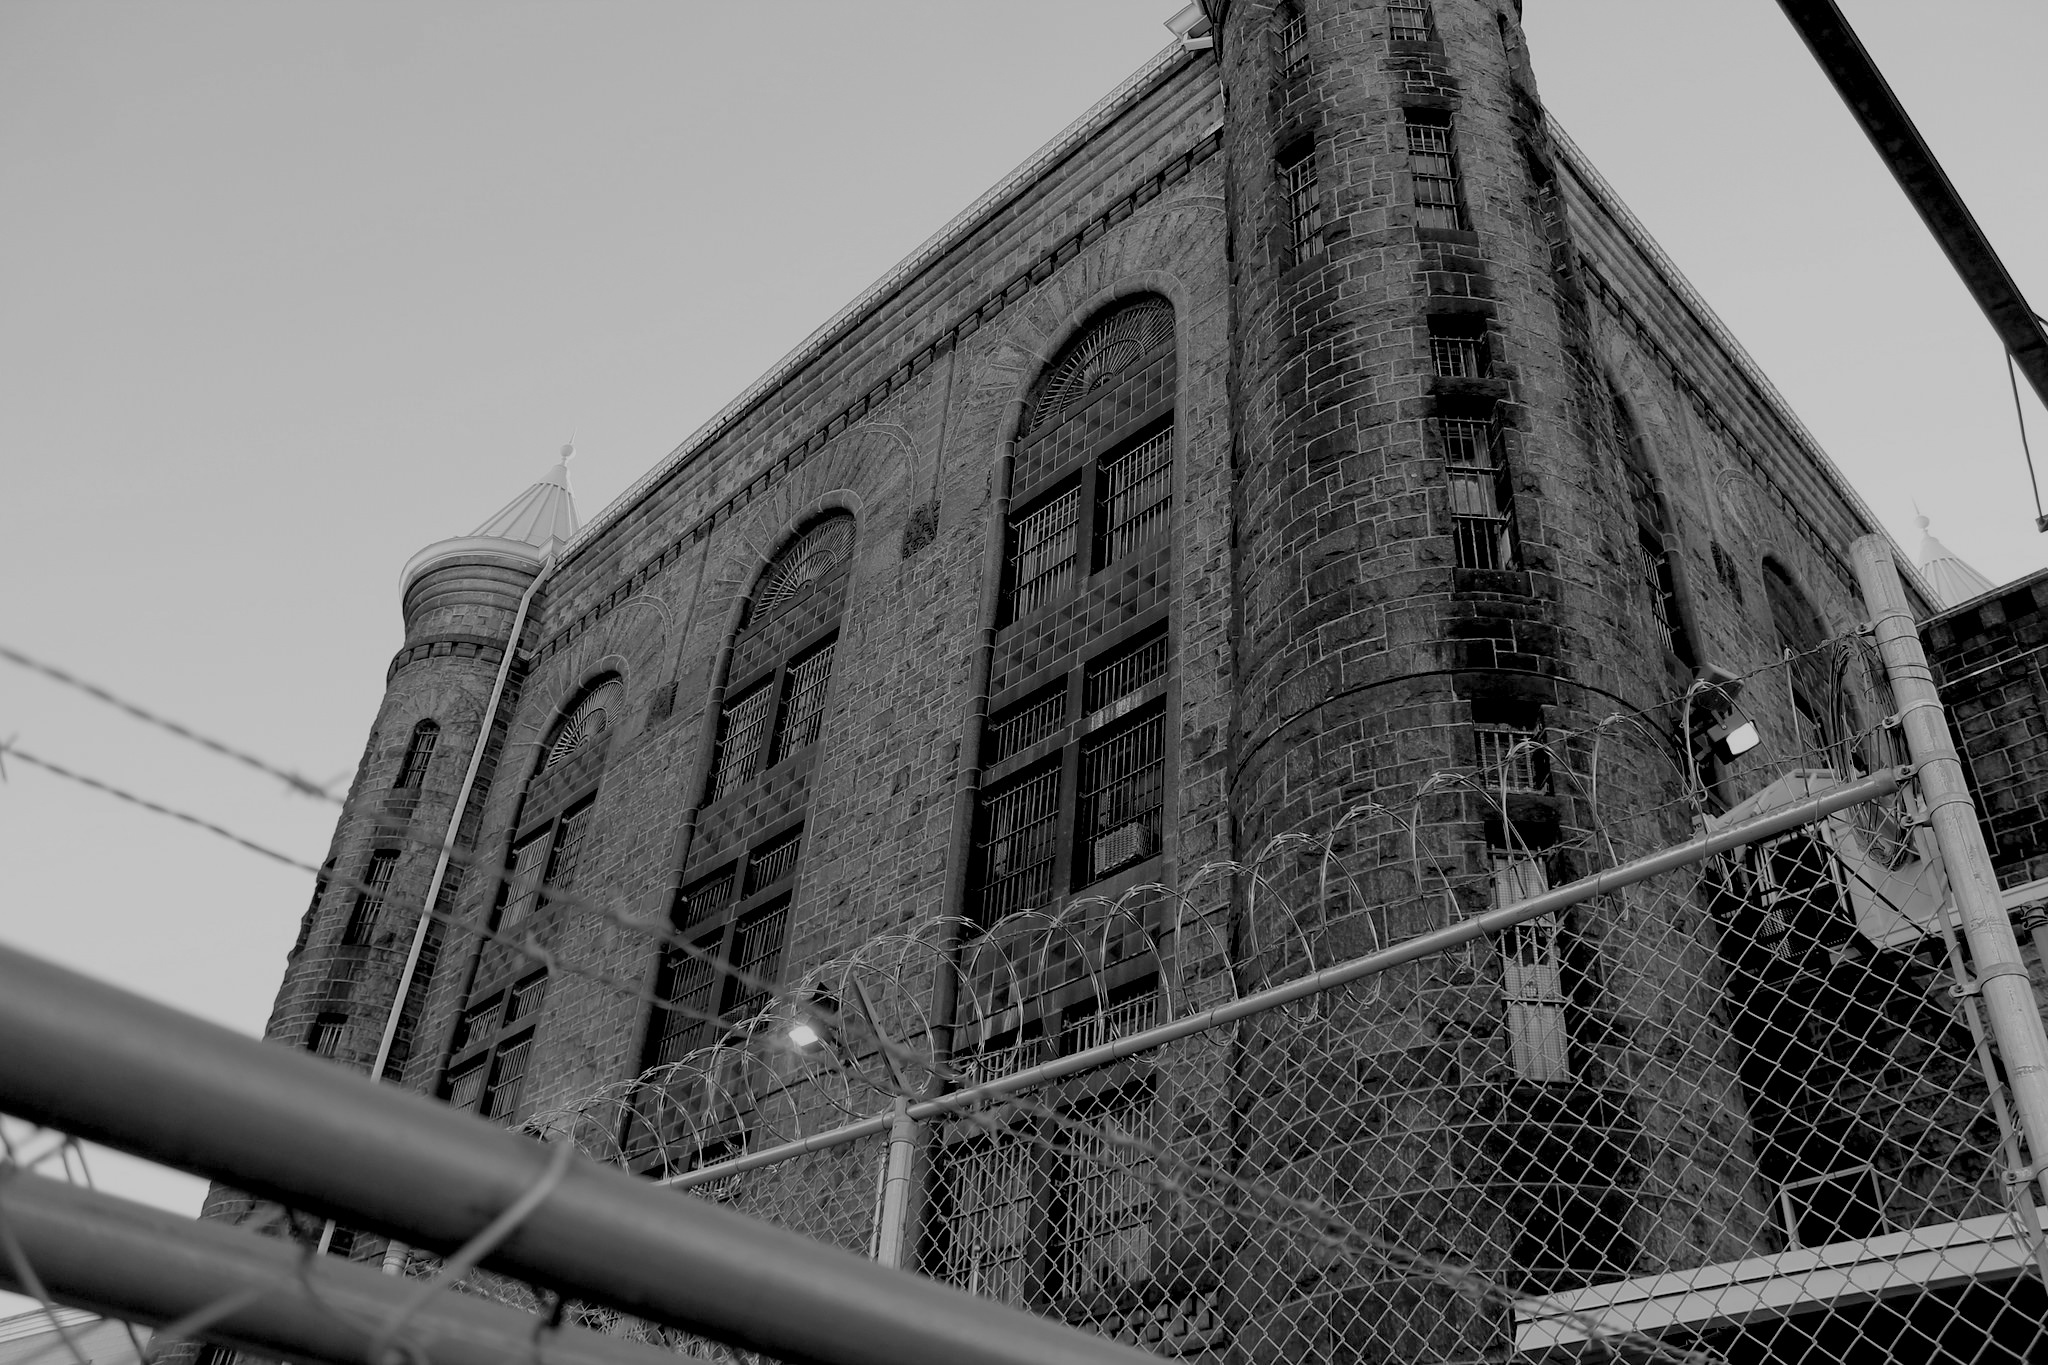
A jail in Baltimore, MD. Elvert Barnes / Flickr
In the 1970s America embarked on a ghastly experiment in mass incarceration. As part of a wider process of criminalization — driven by the “war on drugs,” local law enforcement policies, economic changes, and shifting racial politics — the United States began locking up people in droves. Living in any American community decades later, you can feel its disastrous effect all around you. But how big is mass incarceration’s footprint? How can it be quantified?
One index is the scale of the prison and jail population at any moment in time. It soared from around 400,000 in the mid 1970s to 2.3 million in 2010. That’s appalling, but it understates the impact of criminalization because it does not count those who have been convicted of felonies and not incarcerated. Furthermore, it counts only those currently detained, rather than the entire population of people, mainly men, who have been processed by the system and bear its stigma for the rest of their lives.
Calculating the size of those wider populations requires one to consult a broader array of data not only on the prison and jail populations, but also those on parole and those convicted of felonies as a whole. It also requires us to move from the flow of people processed by the system in any given period to the stock of those who have been affected by it over a period of decades.

To quantify the entire population touched by the system, one has to make certain demographic assumptions about the rate at which ex-prisoners and felons die as well as their recidivism rates (to avoid those who have been convicted, imprisoned, released, and then re-convicted and re-incarcerated being counted many times over).
A post by the excellent Timothy Taylor points to an astonishing study by Sarah Shannon, a sociologist at the University of Georgia, and five colleagues. They estimate that the number of Americans either currently serving a sentence or carrying a felony conviction or prison time in their background quadrupled between 1980 and 2010 — from 5 million to nearly 20 million. Allowing for further sentencing since 2010, it would not be unreasonable to assume that 23 million Americans are thus marked.

Looking beyond those convicted of felonies and incarcerated, a study by the Obama administration estimates that “70 million Americans — or roughly a third of the adult population — have some type of criminal record,” including “those with charges that were dismissed or did not result in conviction, as well as those who have completed their legal obligation to serve time in incarceration.”
Of course, this enormous system of criminalization and punishment operates with spectacular inequalities. In particular, African-American men are vastly more likely to be affected by it than any other group.
America’s police arrest their fellow citizens at an astonishing rate: “30 percent of black males have been arrested by age 18 (vs. 22 percent for white males). . . . This grows to 49 percent by age 23 vs. about 38 percent of white males.”
And on arrest often follows imprisonment. “Sociologists Bruce Western and Becky Pettit have shown . . . that the cumulative risk of imprisonment for black men ages 20-34 without a high school degree stands at 68 percent, as compared to 21 percent of black men with a high school degree and 28 percent for white men without a high school degree.” The rates for black men are obviously shocking, but so too are those for poorly educated white men.
All in all, 15 percent of African-American men in the United States have been to prison (compared to about 6 percent of all adult men). But those figures reflect all men alive, including older men lucky enough to have escaped the great incarceration drive. For younger cohorts the risks are far higher. For boys born in 2001, the lifetime probability of incarceration is estimated to be 32 percent for young black men, 17 percent for Latinos, and 6 percent for whites.

This system of incarceration captures the most disadvantaged in society, disproportionately conscripting from the ranks of foster kids, or kids with parents with a history of incarceration or drug abuse. Thirty-six percent received public assistance. Eleven percent were homeless. Fifty-eight percent have mental health issues.
According to the White House report, the individuals in question were on the whole marginalized from the labor market “even prior to conviction. Estimates from different data sources suggest that as little as 10 percent of this group have positive pre-incarceration earnings and that real pre-incarceration yearly earnings range from $3,000 to $28,000.”
If prisoners have one thing in common, it is that they were poor on the outside.

This is a gigantic machine for destroying life chances. And the bitter irony, of course, is that it is immensely expensive. A prison bed costs between $14,000 and $60,000, varying by state and federal institutions. The cost of a single inmate in one of the higher-cost institutions is comparable to the cost of the police officer who puts them there. Through the US criminal justice, the American state is spending more money on the inmates than it ever spent on them on the outside.
The impact of this machinery on education, employability, and the possibility of forming stable family and social ties are obvious. The vast majority of employers conduct criminal background checks on potential recruits. Thousands of jobs require licenses and certification from which felons are excluded from the get-go.
Not surprisingly, therefore, non-participation in the workforce for prime-age men who have been incarcerated is three times higher than for those who have never been arrested. For white prime working-age men with a prison record, the non-participation rate in the labor force is 17 percent. For black men with a prison record, it is 27 percent.
The non-participation rate for prime age men untouched by the criminal justice system is 6 percent. Once we include the multiply disadvantaged groups who have been stigmatized by it, that percentage rises to 9 percent: i.e. by 50 percent.

In short, America’s machinery of “law and order” is a machinery for confirming and massively reinforcing every dimension of inequality in American society. This is not merely a problem of “bad policy” that can be fixed with small, technocratic adjustments. It reflects deep and ongoing structures of racialized inequality.
This has long been true, of course. But the scale on which this machine operates in the present day, and its impact on the poorest and most marginalized Americans, beggars belief.